.png)
- ARTICLE
- CROP MANAGEMENT
- WEATHER
Managing Crop Risks Through Grower Alerts
Discover how growers use predictive alerts to manage crop risks from frost, diseases, and extreme...
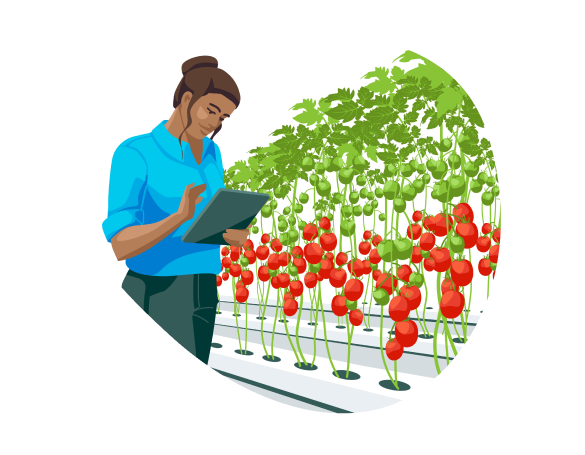
Tomatoes are one of the most grown fresh produce crops in the world. While the majority are grown in open field, recent decades have seen an increase in protected or controlled environment production. By utilizing protected environments such as plastic houses, greenhouses, or glasshouses, tomato growers can produce crops for most of the year and better protect against unfavorable weather conditions, pests, and diseases.
A further benefit is that controlled environments enable growers to manipulate environmental factors such as climate, water, and light to improve produce quality and achieve around a 5-fold increase in production, compared to traditional outdoor cultivation.
For tomato growers, predicting yield is a crucial practice that drives both short-term response and long-term strategy within their business. Yield prediction assists growers to steer their crop to a desired production outcome, provides a level of certainty on the available produce for sale, and serves as an indicator for supply contract fulfilment.
Yield prediction is difficult and complex but necessary as the financial impact of over or under-producing is one of the most significant challenges for today’s growing teams.
While many growers aim for a high level of yield prediction accuracy, they may not achieve it consistently. For example, a greenhouse grower may achieve an average of 85% accuracy overall but experience a week- on-week variation between 65% and 95% accuracy. Such variance is problematic for business operations and forecasting. A common cause of this variance is the occurrence of sudden spikes or dips in the actual yield, called yield swings. Yield swing weeks are the most difficult weeks to predict in any crop cycle. The unexpected low or high yield swings can be the result of biological, environmental, or other external factors that traditional yield prediction modeling may not account for.
Therefore, we need to consider whether chasing the "holy grail" of high accuracy yield prediction is the right approach. If not, then can we identify and describe biological and environmental events leading up to yield swings? And to what degree would taking a more holistic approach to interpreting yield prediction improve confidence in the prediction? These are the critical questions that we need to ask ourselves to maximize yield.
Yield prediction in tomato cultivation requires a vast amount of historical data. This data is used to train artificial intelligence (AI) models to calculate yield averages for future yields. However, such a volume of data is not always available. Even when it is, past events may now not be a good indicator of the future due to changing climate, weather patterns and the emergence of new pests and diseases; or their increasing prevalence and intensity.
Growers understand that tomato production is vulnerable to adverse environmental events and other non-environmental factors. These factors include changes in crop biological measures, modifications to growing practices, and external factors like COVID-19 lockdowns or public holidays. Such events can cause swings in yield, pest and disease infestation, crop/financial losses, and unintended excesses.
.png?width=578&name=Image%20(26).png)
To achieve oversight of these factors, growers measure numerous parameters including climate, irrigation, and crop development. Crop development is measured in a practice known as crop registration, which includes measures such as plant stem diameter, plant length, number of leaves/flowers/fruits, and the speed at which flowers are produced and pollinated.
Growers often manage crop outcomes using yield prediction in conjunction with plant balance.
Plant balance is the optimum state that enables plant development in line with growth milestones and target yield. By understanding the current plant state (either vegetative growth e.g., producing more leaves and stems or generative growth e.g., producing more flowers and fruits), growers can ‘steer’ the crop in a particular direction to meet their production targets.
With the breadth of data at their disposal growers should be able to surface some clues on yields swings and the factors at play in the lead up to them. Furthermore, if growers could predict when a yield swing is likely to occur and identify the cause, pre-emptive actions can be taken. Like a weather forecast, if you know there is a 30% chance of rain, you can be prepared and have an umbrella handy.
%20(1).png)
The team of crop and data scientists at WayBeyond help tomato growers improve their yield prediction. Using proprietary digital data collection, data analysis algorithms and AI models, their goal is to provide a wider understanding of yield prediction by studying data on plant genetics, environment, and crop management practices.
To demonstrate the value of a more holistic approach to predicting yield, the team collated and analyzed anonymized data from 20 tomato growing cycles from growers in varied protected growing environments.
Yield swings are defined as sudden and significant variance in yield compared to the yield in surrounding weeks. We set out to find factors associated with week-to-week variability in yield prediction accuracy.
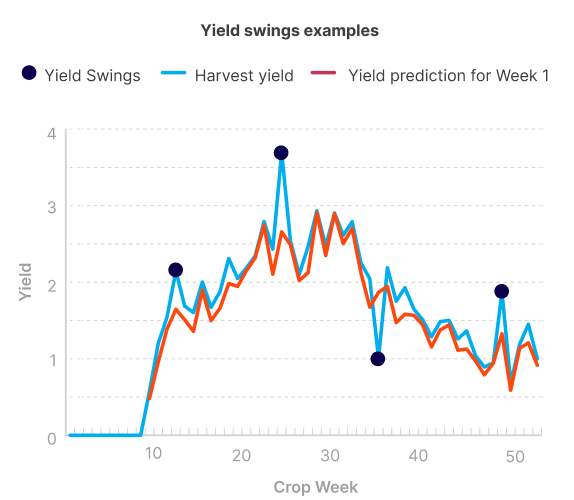
To predict yield, we utilized a proprietary AI model that allowed us to forecast one week and four weeks in advance. We did this for each week in the crop cycle. During analysis, we used proprietary algorithms to identify the yield swings within crop cycles. Yield swings are represented visually as sudden and significant jumps or drops in yield compared to the yield in the surrounding weeks in the graph below.
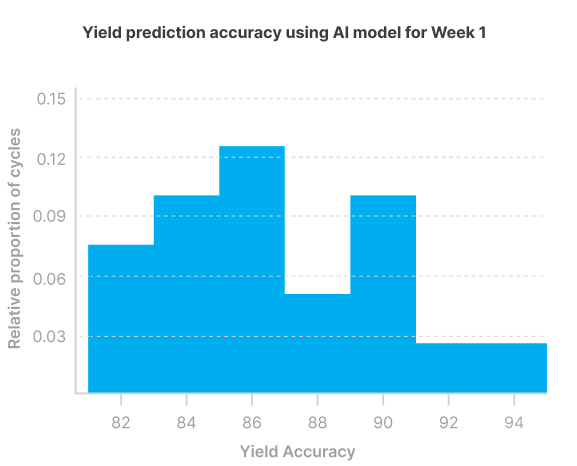
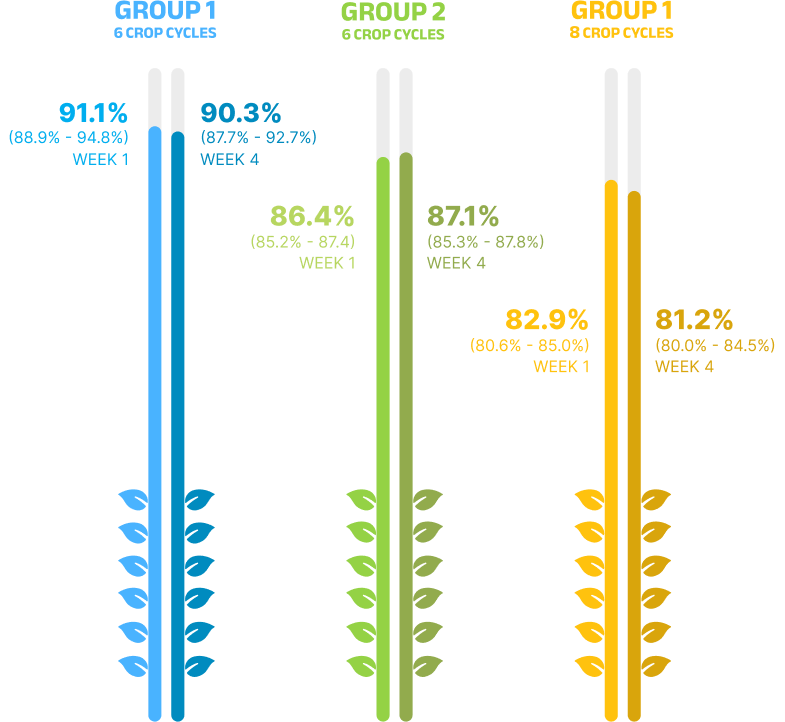
The accuracy of yield prediction for one week ahead using the AI model ranged from 81-95%.
We classified the crop cycles into three groups, based on the accuracy of yield prediction one week ahead: -
The average accuracy one week and four weeks ahead was: -
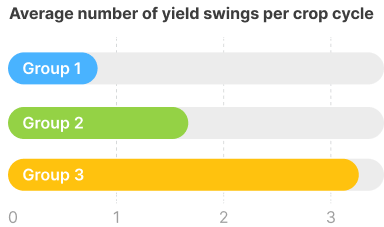
In each group, the yield swings were identified and counted using proprietary algorithms. Group 1 had the lowest average number of swings (0.83) whereas Group 3 had the highest average number of swings (3.25).
To better understand events leading up to yield swings, we collected environmental and biological data from the eight weeks prior to each swing. Our hypothesis was that the data would reveal patterns or events occurring before swings, which could be used as indicators to predict swings in the future.
Environmental data consisted of climate data including the outside and inside protected environment temperature and humidity. Biological data included crop registration measurements of weekly growth, truss height, leaf length, stem width, and the number of leaves. We also used a proprietary plant balance model to measure plant balance.
We standardized the data collected using proprietary algorithms, and then derived scores which indicated the deviation of each weekly measurement from what would normally be expected for the given week (deviation scores).
We then identified and tallied common patterns in deviation scores in the environmental and biological data leading up to yield swings. Next, we identified patterns that had the strongest correlations with low and high yield swings. Finally, we described the identified patterns in a contextual manner, such as 'low light in the last eight weeks,' and the risk of swing they posed to yield, for example, 'risk of low yield in the next three weeks' for a low-light pattern associated with a low yield swing.
Note: We did not interpret irrigation data or pest and diseases in this study, because irrigation and pest management practices are highly variable among growers and have a direct impact on yield. Thus, both should be incorporated into interpreting data on yield prediction and making yield decisions.
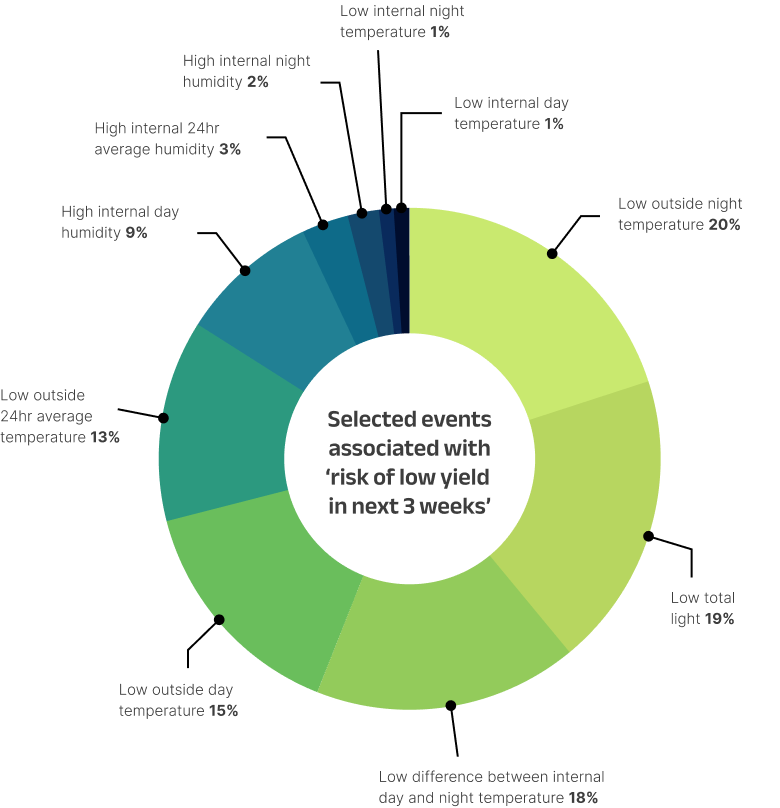
The most common patterns observed in the eight weeks before the occurrence of low yield swings were as follows:
These events can serve as a warning to tomato growers of a possible low yield swing associated with the identified patterns. The warning can be framed as 'risk of low yield in the next three weeks'.
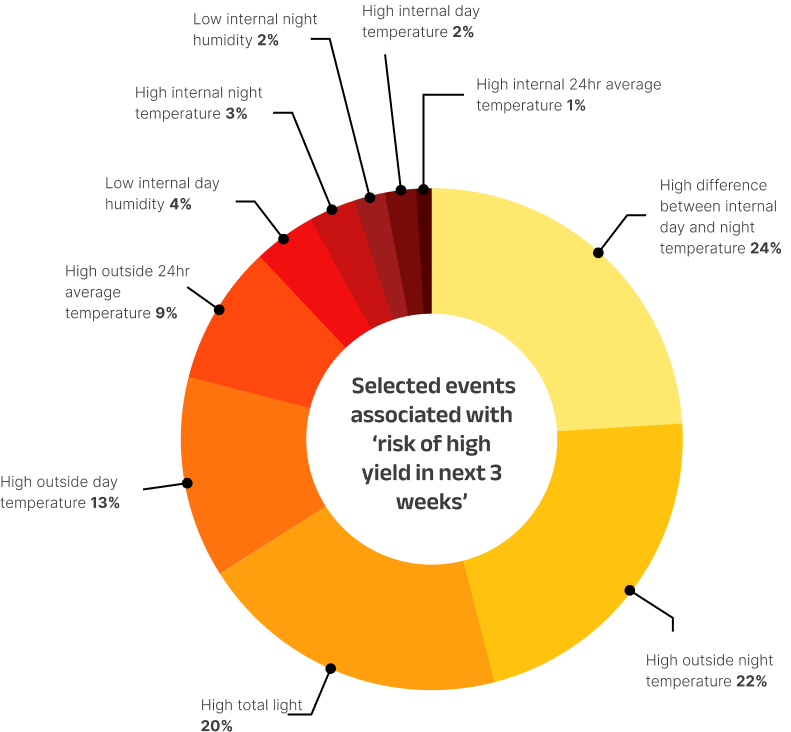
The most common patterns observed in the eight weeks before the occurrence of high yield swings were:
These events can also serve as a warning to tomato growers of a possible high yield swing associated with the identified patterns. The warning can be framed as 'risk of high yield in the next three weeks'.
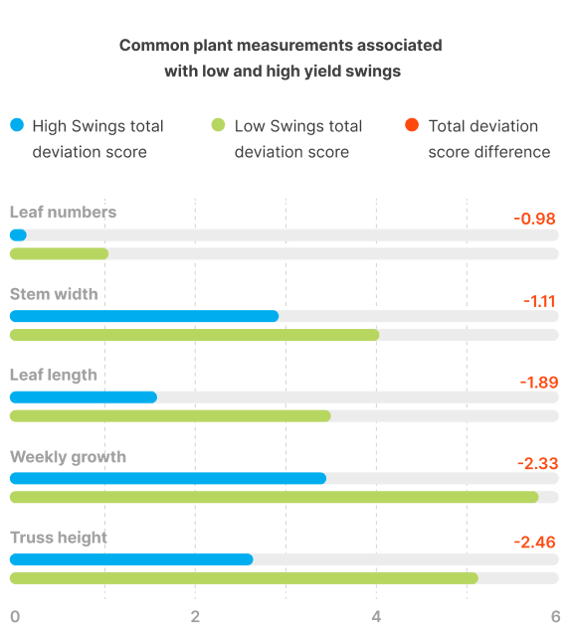
We analyzed and compared plant growth measurements from weeks leading to low and high yield swings using tabular analysis of the deviation scores as described earlier. Weeks leading to low yield swings showed evidence of greater vegetative growth as shown by plant measurements compared to weeks leading to high yield swings. For example, a higher deviation score for leaf numbers in weeks leading to low yield swings is indicative of more leaves and therefore greater vegetative growth than in weeks leading to high yield swings.
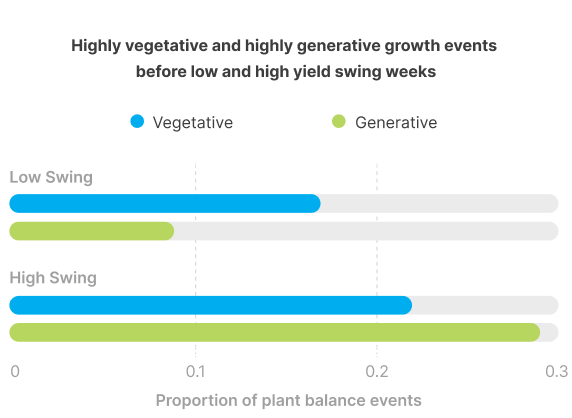
For each week with a swing, we also counted the number of weeks in the preceding eight weeks where plant balance indicated highly vegetative or highly generative growth. This was conducted using plant balance scores from our proprietary model.
This 8-week period was categorized depending on whether the majority of those weeks were highly vegetative or highly generative. If they were, the 8-week period was denoted as a vegetative or generative event, respectively. We then compared the proportion of vegetative or generative events in the weeks leading to low and high yield. This indicated more generative growth events in the weeks leading to high yield swings than in the weeks leading to low yield swings.
Yield swings impact the accuracy of yield prediction models. To help tomato growers manage these swings, we were able to identify key environmental and biological patterns in the weeks leading up to swings that are commonly associated with low and high yield swings. These patterns represent the contextual layer which can be utilized in conjunction with yield prediction to expand a grower’s decision-making capabilities and thus to help them anticipate and manage yield swings in protected environments.
If growers can identify the patterns that occur before swings, they can anticipate them and interpret yield prediction with this in mind. Different growers will be prone to different risks depending on their level of protection and crop management, and identifying patterns relevant to them will help them interpret their yield prediction with relevant context.
With this understanding, they can anticipate swings and interpret yield prediction with greater accuracy. Over time, growers can also learn to mitigate the risks of swings happening in the first place, leading to more consistent crop management and higher quality data.
Based on our analysis, we suggest that yield prediction becomes a more effective decision-making tool when it is supported by relevant insights from environmental and biological data. By collecting and analyzing environmental, plant and context data, tomato growers can gain a more comprehensive understanding of their growing environment, crop and management practices. This helps them anticipate yield swings, make informed decisions on yield prediction and crop management, and avoid financial or produce losses.

Dr. Mpatisi Moyo obtained a BSc and Master’s in Medical Laboratory Sciences from the University of Zimbabwe and Massey University, respectively. Followed by a Post-Graduate Diploma in Statistics then completing his PhD in Health Sciences from the University of Auckland. Mpatisi has over 15 years’ experience in data science, analytics and AI across healthcare, government, telecommunications, energy, finance and agritech sectors. He heads Data Science and Artificial Intelligence at WayBeyond. His team focuses on combining biology, data and AI to build smart insights, prediction and recommendation tools to help growers improve efficiency in their production.
.png?width=276&height=308&name=ID%20Photos%20(2).png)
Dr. Tharindu Weeraratne is an academic, AgTech, and farm consultant specializing in plant physiology, plant pathology, molecular genetics, crop science, and agronomy. After obtaining his BSc in Botany in Sri Lanka, he did research in postharvest biology and technology of cut flowers and foliage. He did his PhD in Plant Biology at the University of Texas at Austin. Tharindu leads the Crop Science, Agronomy Research and Consulting at WayBeyond, and works with AI research and engineering teams to provide cutting-edge solutions for growers. He also support growers with agronomic and crop consulting using WayBeyond’s solutions.
.png)
Discover how growers use predictive alerts to manage crop risks from frost, diseases, and extreme...

Spraying your crops in poor weather conditions can waste chemicals, increase costs, and harm...
Daniel Than, Customer Success Director at WayBeyond, explains why actionable climate insight—not...
.png)
Learn how to manage weather-related risks for your crops using an early warning system such as...

WayBeyond’s new GrowPilot app brings artificial intelligence into the hands of small to...
From cutting water use in drought-hit regions like Morocco to preventing thousands in losses from...

When faced with crop losses due to climate events and system failures, Eliven Tropical turned to...
A leading Moroccan berry grower cut water use by 16% using climate data and ETo-based irrigation....
ETo forecasting is a simple but powerful tool for optimizing irrigation every day, in every season....
See the strategy behind evapotranspiration-based irrigation planning that helped a greenhouse...

Learn how a people-first approach to change management empowers growers to successfully transition...
The grower's guide to using data for effective crop management. Get practical tips to achieve...

With late blight causing crop loss and large costs, Agrícola Chaparral turned to digital agronomy...

Learn how six key weather data points can help you make smarter irrigation decisions, conserve...

A smart approach to water management is key to helping growers tackle water scarcity and climate...

With over 470 ha of blueberry production, African Blue needed to unify farm data to improve crop...

Uncover the vital role of drip and drain monitoring in optimizing drip irrigation farming.
Explore how protected cropping growers can use data insights to drive smart irrigation practices.
Heat stress is a significant concern for berry growers as it has both positive & negative effects...

Real-time alerts play a vital role in empowering growers to make better crop management decisions.

Real world examples of common issues faced by growers that can be solved with real-time data,...
The protected crop growers guide to successfully managing your plants, team, practices and...
SaaS adoption in horticulture: discover challenges and pitfalls for both growers and technology...

Frost devastates blueberry crops, leading to significant economic losses. By harnessing digital...
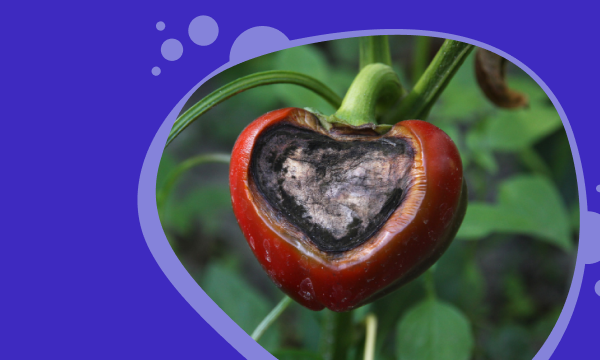
Digital agronomy insights helps tackle crop loss, production variations, and declining yield by...

3 production problems that can be solved by collecting data: cross loss from disease, poor crop...
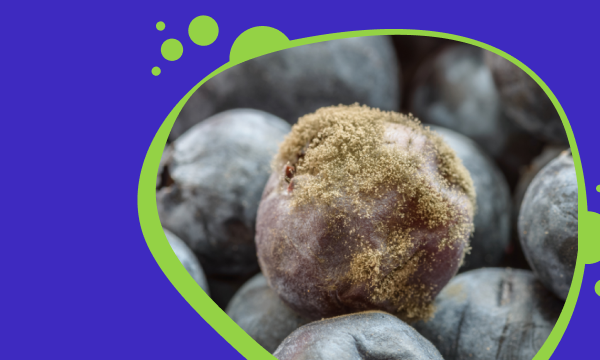
Discover the true cost of a fungal disease outbreak in crops, how to respond and the financial...
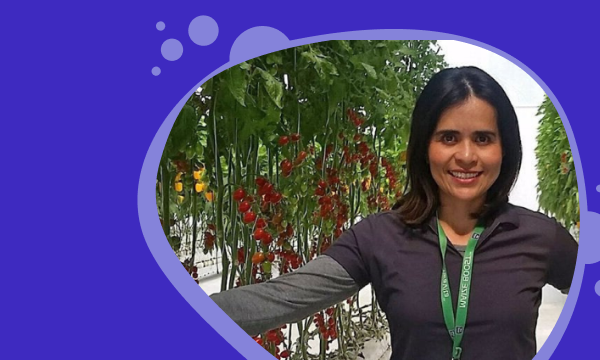
With protected agriculture on the rise, Mexico is ripe for the next wave of tech innovation.

Get insights on Integrated Pest Management planning for effectively managing infestations.
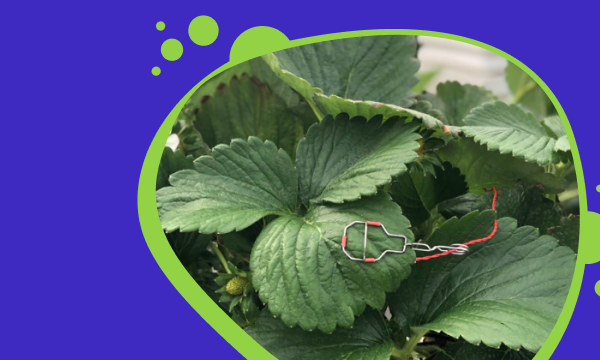
Learn how to manage plant stress and improve crop performance with Vapour Pressure Deficit.
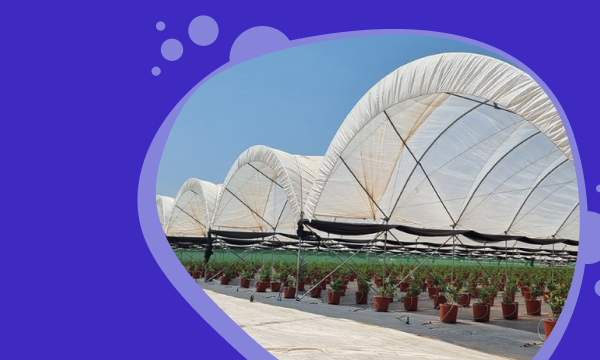
Harnessing FarmRoad enabled to monitor the status of their crops and the farm as a whole and...
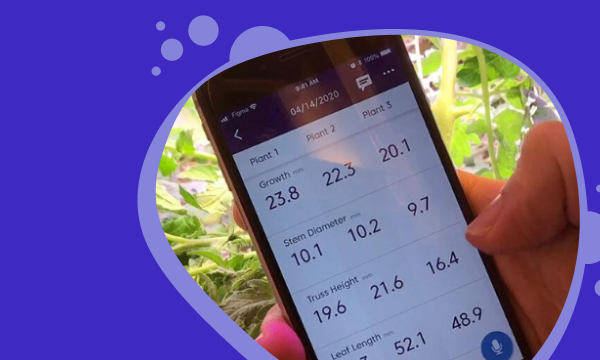
Why do growers use crop registration and how does it benefit crop management practices?
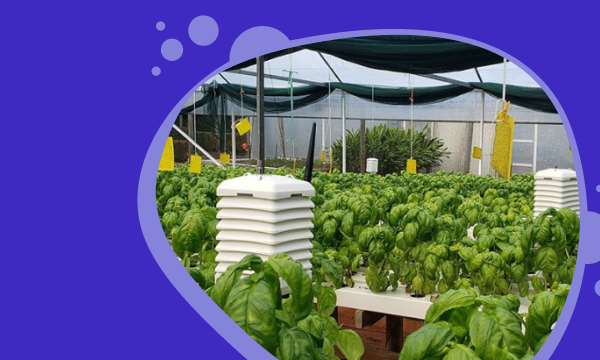
Growers require frequent and detailed climate data and crop status visibility to get the best from...

The agronomist at Season Farms noticed a drop in production and turned to WayBeyond's digital...

Plant pathology is the study of plant diseases and how they interact with plants. In this in-depth...
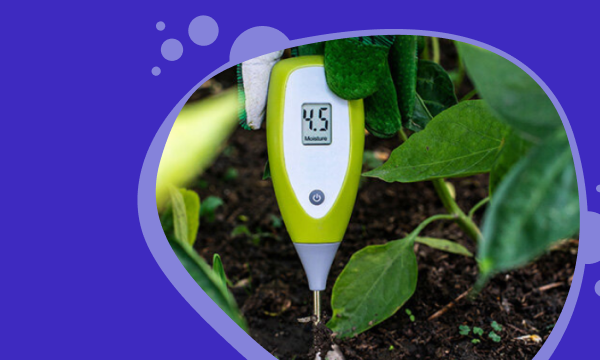
While the popularity of hand held moisture meters for plants shows no signs of abating, there are...
Champions of crop management.
Giving commercial growers the power to make better crop management decisions and optimize crop outcomes.
Solutions
Customers
©2025 WayBeyond. All Rights Reserved.