.svg)

.svg) SEARCH
SEARCH

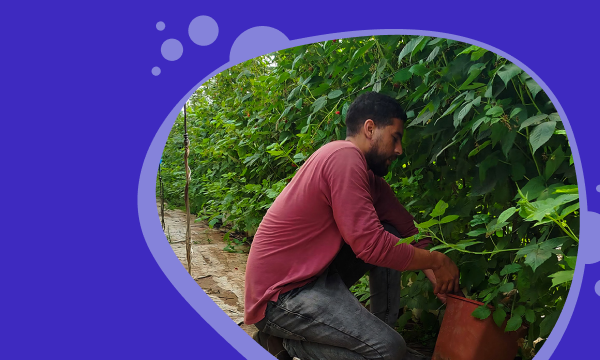
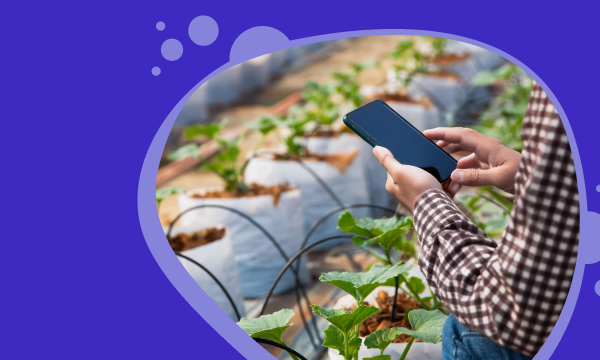
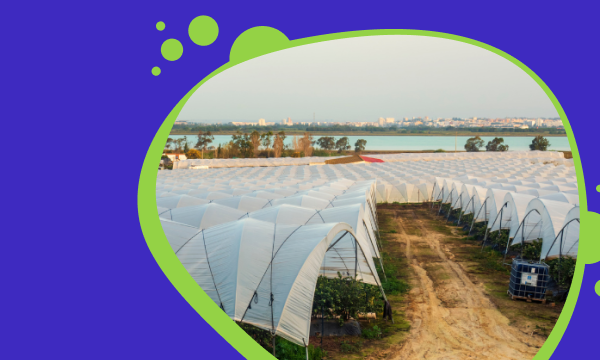
When we ask growers how we can help them, they say “We want to reduce pests, diseases, and wastage. To use less water, less energy and less pesticides. In short: we want to be able to do our jobs better.”
Of course, these are a complex set of requests with no single ‘silver bullet’ solution but one of the ways to help these growers do their jobs better is by helping them collect and harness data and train them to interpret it so they have a greater level of confidence in the decisions they make every day.
In this blog post we’ll discuss 3 common issues that can be addressed by collecting and analysing data.
-
Crop loss due to disease.
-
Variation in production output across sites
-
Declining crop yield and quality
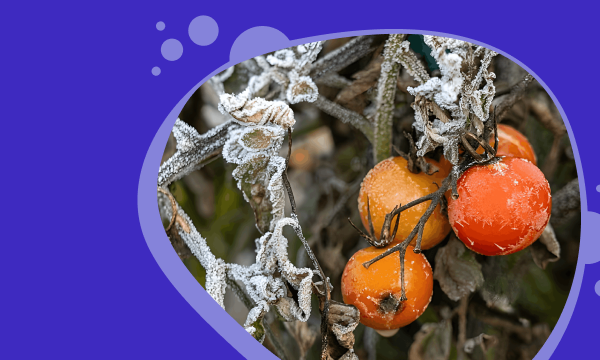
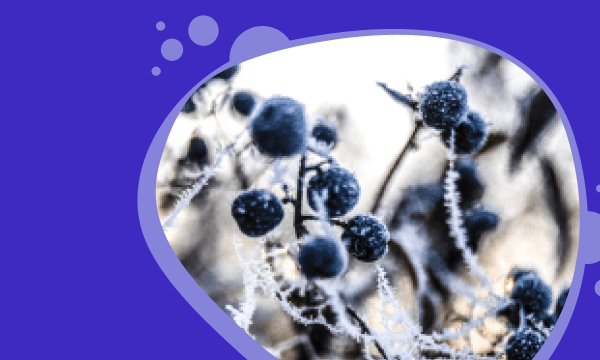
1. Crop loss due to disease
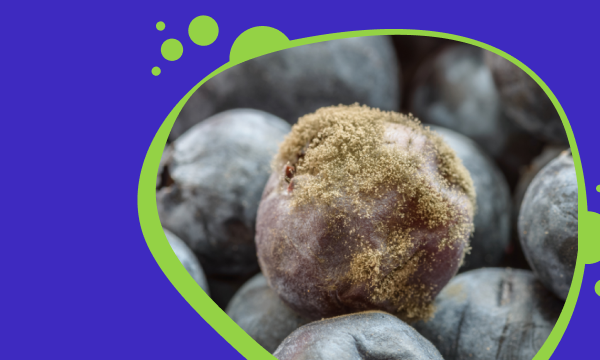
According to Rabobank, Botrytis (or grey mold) causes an estimated USD 10 Billion of economic loss per year, worldwide.
Botrytis is a very common disease. It is a fungus that once established, can multiply rapidly because it produces a large volume of spores.
To infect plants disease spores first need to germinate. This requires a source of moisture (dew, high humidity) combined with moderate temperatures. The disease requires this high humidity for an extended period of time (between 3-8 hours) and an ideal temperature range of 13-23C.
Once these climate conditions are met, the disease thrives and becomes visible on plants about 2 weeks later.
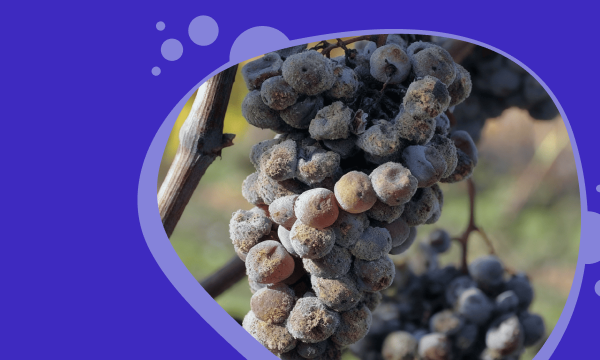
Disease profile of Botrytis
-
Conditions for an outbreak are simple
-
Multiplies rapidly
-
Is hard to eradicate
-
Prospers in conditions 13-23C (55-73F) in conditions greater than 90% humidity
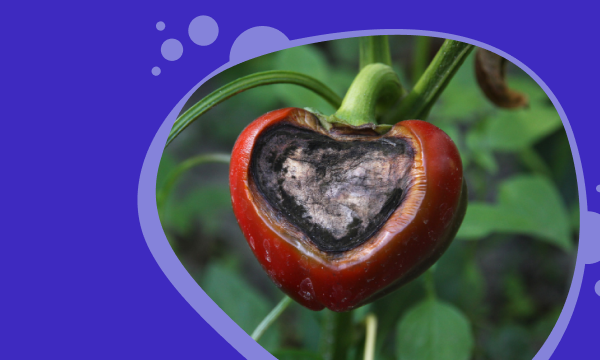
40% crop loss is the final straw for one grower
One grower who approached WayBeyond was losing an increasing percentage of their crop each year due to Botrytis. The turning point came when that percentage finally hit a shocking 40% – for a 1 hectare greenhouse that represents over USD 150k in loss.
The grower now wanted to solve the problem urgently, but without continuous data, it was hard to understand when the problem was happening and what action to take.
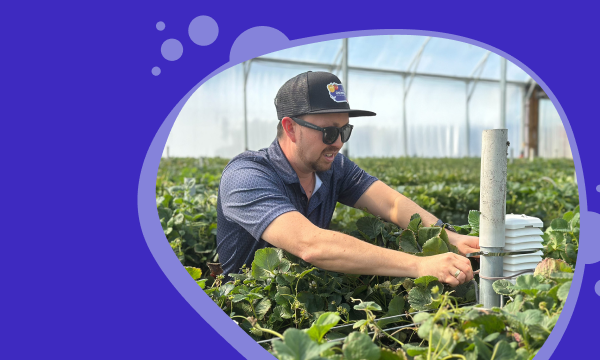
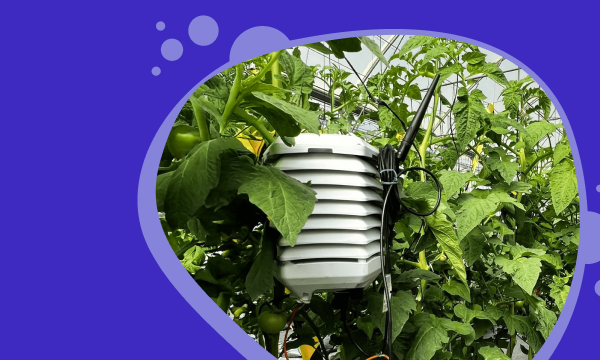
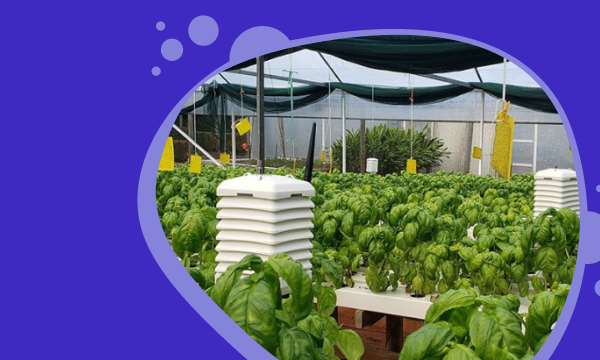
To investigate the issue our portable wireless sensors were deployed and after a period of time, the data was studied. Here’s what was discovered.
 Click for larger image.
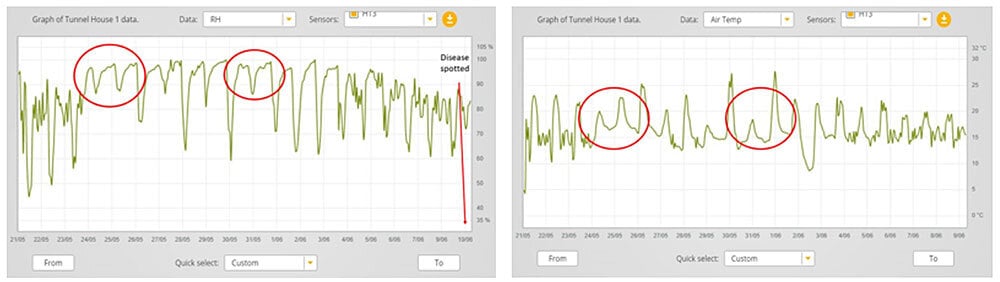
These are the graphs from the sensors. On the left is Relative Humidity and on the right is Air Temperature. The graphs show that two weeks before the disease was spotted by scouts, the humidity was exceptionally high, hitting the dew point several times for a sustained period while the temperature during that same timeframe was in that 13-23C zone.
By viewing this data and using information on Botrytis epidemiology, the grower was able to see what was contributing to their problem. This data provided the intelligence for the grower to make changes to their environment and future crop practices.
Additionally, as a fail-safe, alarms were set to trigger should climate conditions become perfect for the disease to flourish again, so growers would get fair warning to take remedial action.
Being able to track disease over time is important as it enables you to study correlations between disease prevalence and climatic conditions.
Other useful indicators to combat crop disease
Plants may also be more susceptible to disease if they are weak, wounded or stressed, so collecting additional data provides more context and helps build a picture of disease risk.
An important reading to capture is Vapour Pressure Deficit (VPD). VPD is the difference between the pressure exerted by water vapour held in saturated air and the pressure exerted by the water vapour that is held in the air being measured at the same given temperature. This difference is what drives transpiration from the plants' stomata and so provides an indicator of current plant stress levels.
Low VPD for example means low transpiration and would cause plant metabolism to slow down, inhibiting development and increasing susceptibility to disease.
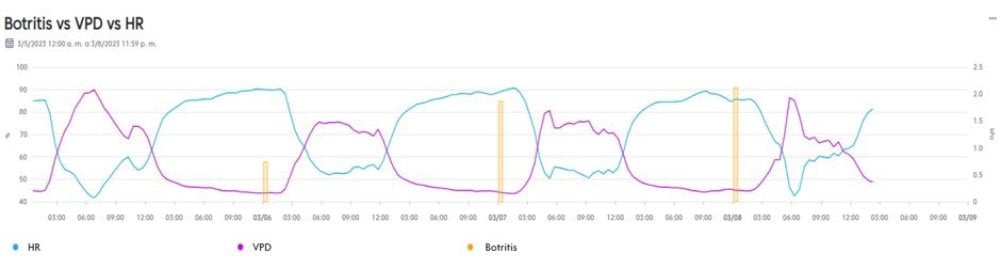
In this graph you can see exactly this. Here we observe periods of high humidity and low VPD which in a short period become ideal conditions for an outbreak of Botrytis to occur.
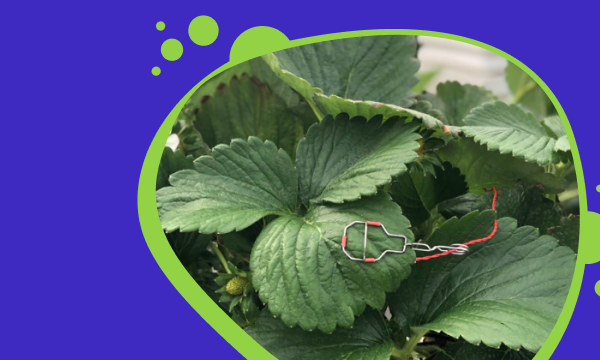
VPD can be captured with a plant temperature sensor placed directly on the stem or leaf. Many systems offer an estimation of VPD but a plant temperature sensor provides actual VPD.
When it comes to disease it's best to consult a plant pathologist. They need to understand your situation to provide recommendations and the more data you can provide to them, the better they can do their job to help you.
2. Variation in output across sites
Our next example involves a grower who received complaints from a supermarket they supplied about their product’s shelf life. The supermarket expressed serious concerns as shelf-life was very poor. But only a percentage of the product supplied had a short shelf-life while the rest were fine.
When this was investigated, the grower found the poor shelf-life product originated from one greenhouse while the rest were grown in another. So what was happening in that greenhouse? They needed the answer to salvage their relationship with the supermarket.
First steps to revealing the issues
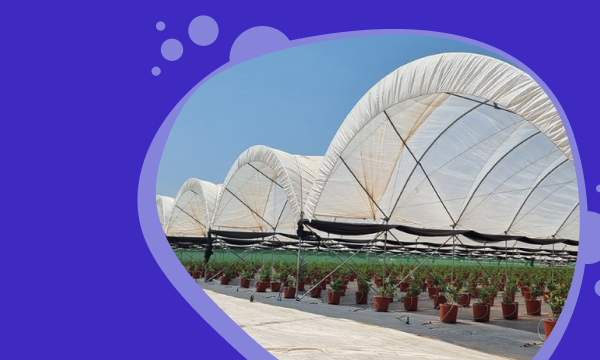
Their first step was to install our portable wireless sensors in both greenhouses to capture air temperature, radiation, humidity, and carbon dioxide. The installation meant they could compare conditions in each greenhouse, to benchmark one against the other. If they could replicate conditions from the high performing greenhouse in the poor performing one, the product shelf life could be improved.
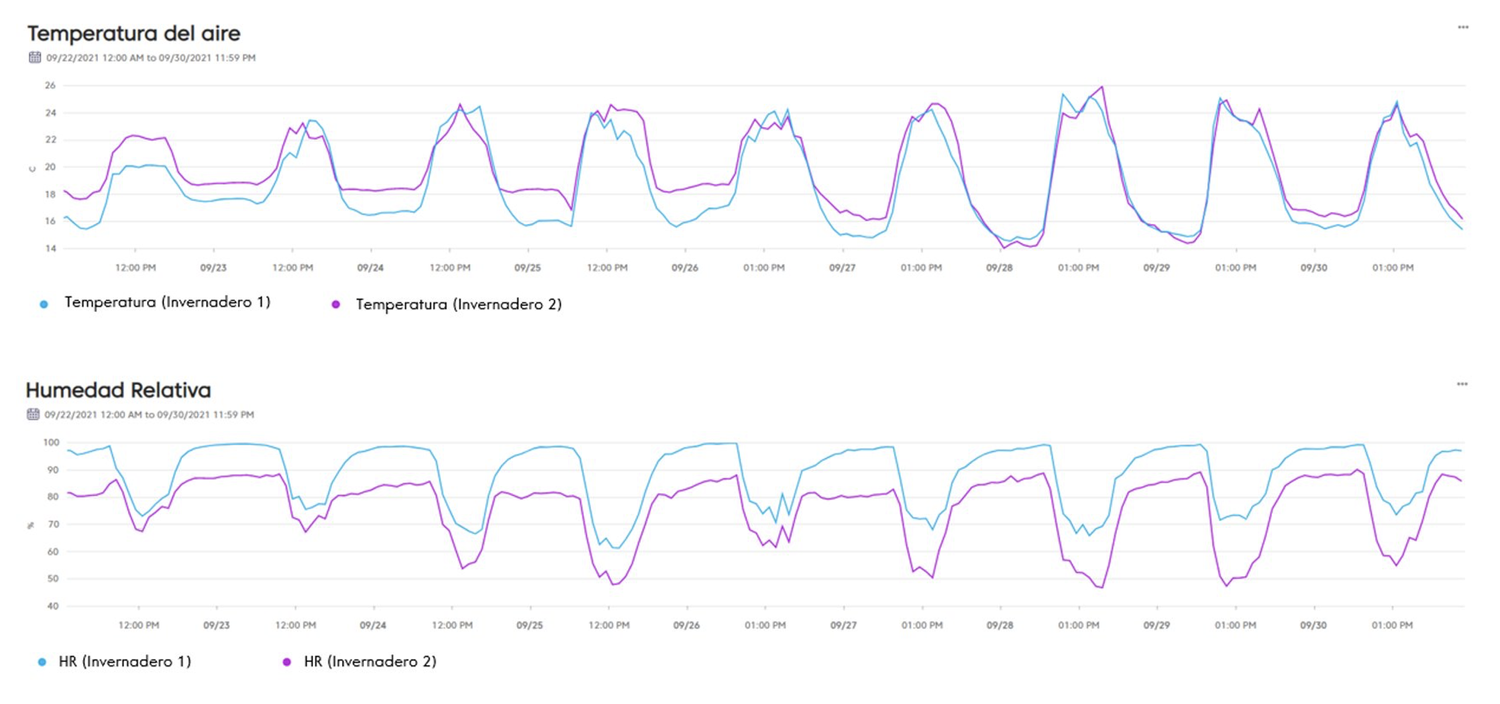
Studying the data revealed stark differences between the climate conditions in these two greenhouses. Greenhouse 1 was the poor performer. Compared to Greenhouse 2 it had lower night temperatures and higher humidity. Additionally, there was a difference in radiation and CO2. You can see in Greenhouse 1, there was a larger variation in the CO2 compared to Greenhouse 2.
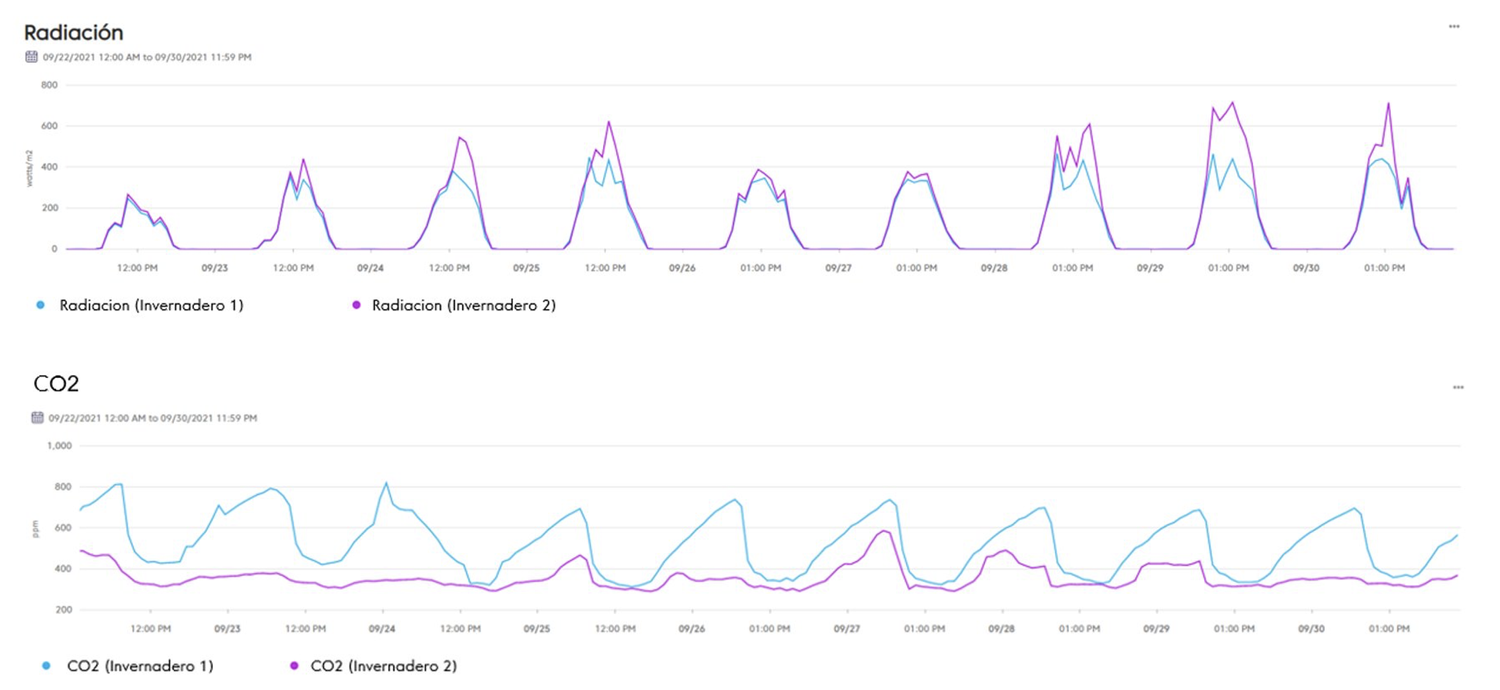
Why was Greenhouse 2 performing better?
Greenhouse 2 had higher night temperatures which meant higher 24hr average temperatures. Generally higher average temperatures are better for growing. Greenhouse 2 had higher radiation which produced stronger, sturdier plants. Greenhouse 2 also had lower humidity so therefore lower disease risk. Lastly Greenhouse 2 had smaller CO2 variation.
This last point, the grower discovered, was because Greenhouse 2 had a ventilation fan which enabled better air flow to the plant and better CO2 oxygen flow within the plant.
So by uncovering these factors and with the data to provide solid intelligence, they could confidently invest in improving the infrastructure of Greenhouse 1 to bring it into line with Greenhouse 2 and increase their shelf life.
Variance in production is something that growers want to avoid but often one facility produces more than another. While they may have a hunch on the reasons for this, they can only put forward their best guesses. Without tangible data to draw conclusions, it is very hard to propose changes or make investments that might improve the output of the lagging facility.
3. Declining crop yield and quality
The last example is from a farm that was experiencing lower crop yield and quality. The grower noticed this reduction but the causes weren’t clear.
When it comes to their plants, grower get a lot of satisfaction from successfully trouble-shooting issues – so it bothered him that he couldn’t find an explanation.
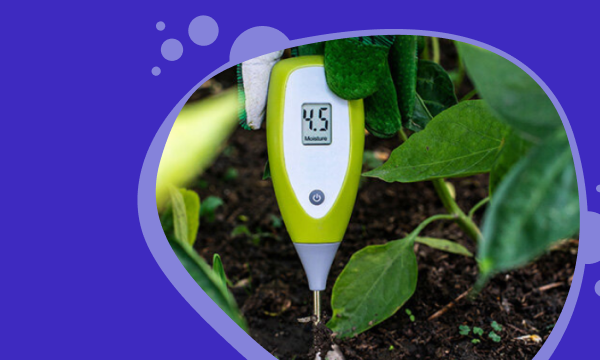
While he had his suspicions – he thought perhaps it was something happening during the crop cycle – he wanted to know the real reasons. But at that time only handheld readings were taken – there just wasn’t enough data to be useful in finding an answer.
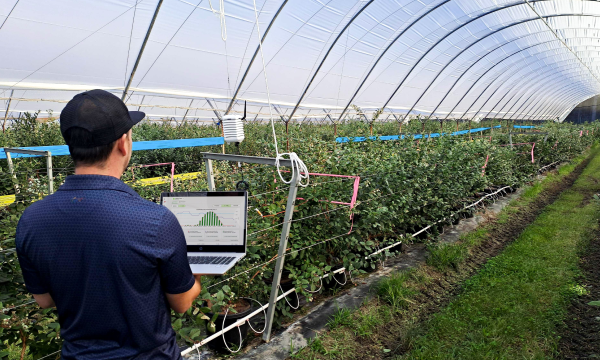
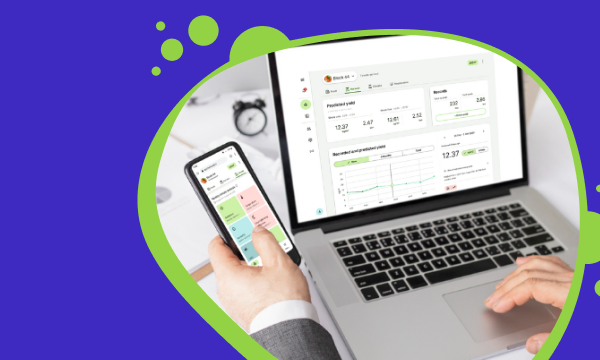
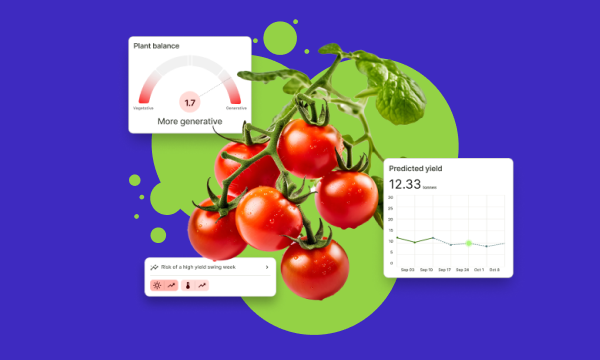
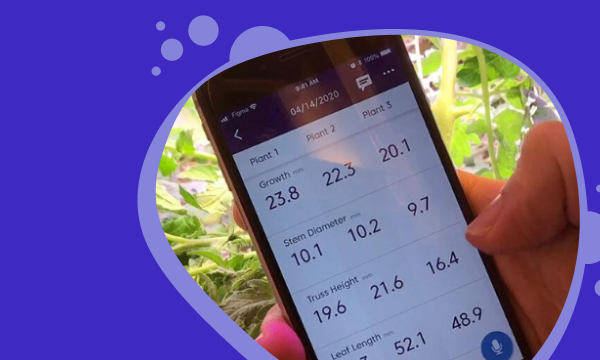
Our portable wireless sensors were deployed in the area of the tunnel house where the problem was occurring and real-time climate and environmental data began trickling in. He also used our mobile app to regularly collect data on crop growth, digitally.
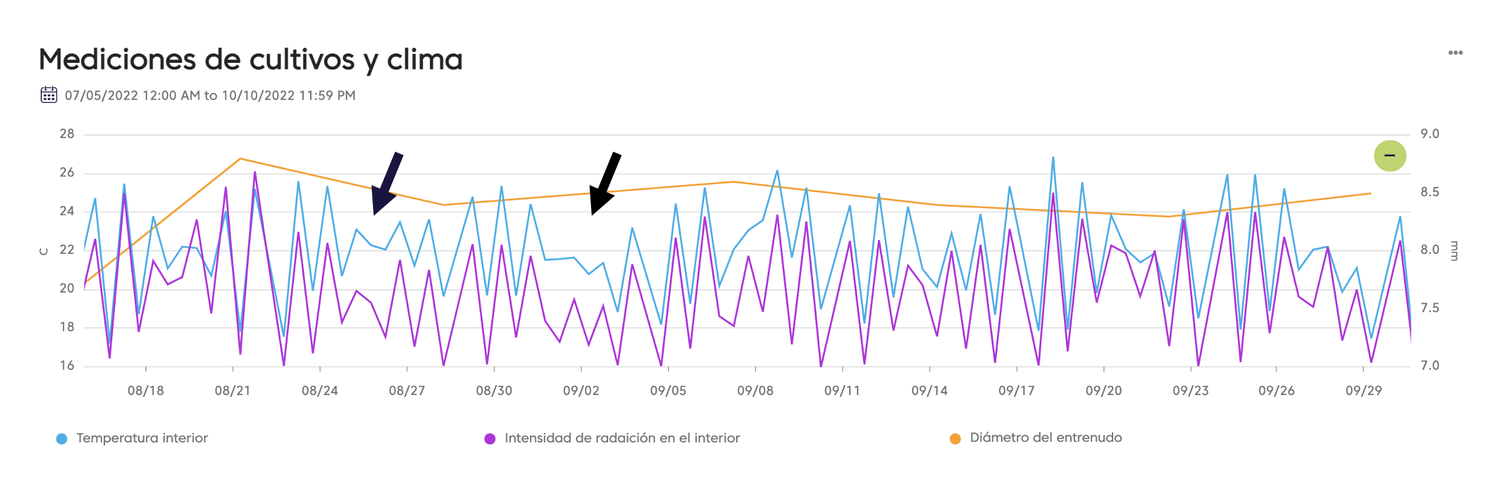
As the data accumulated, the grower noticed periods of poor plant growth which may have contributed to the reduced crop yield and quality. Digging deeper, the data revealed climate influences for that period. He could see that poor plant growth (indicated by lower stem diameter) may have been due to assimilate limitations (for example, sugars produced by photosynthesis) when he looked at the light and temperature curves.
Today, the value of data for this grower is in the ongoing awareness of plant health and the ability to take action with a higher level of certainty than just best guesses. He acknowledged that if the right kind of data had been collected sooner, this issue could have been managed by adjusting the climate to maintain active growth and avoiding stressing the plants.
Now he has experienced this crop health visibility from data and the advantages it provides, he is a convert to digital agronomy and will continue to collect and analyse data to help him grow better crops.
Solving these kind of problems by collecting data doesn’t have to mean huge investment, disruption or months of tech training. Small steps can be made today with simple digital tools so you get a clearer picture of your environment, climate, crop health and events that might threaten it.
If you are not collecting data, begin as soon as you can. If you are already collecting data, ask yourself “Is it comprehensive enough?” i.e. would the data you currently collect help you investigate and resolve the 3 issues above?
Ideally your data should be:
-
continuously captured
-
Visible as graphs and charts
-
contains as many data points as possible
-
accessible from anywhere to the individuals that require visibility
Steps towards data driven decision making
Collecting and analyzing data is a powerful tool in addressing common problems in controlled environment agriculture. By harnessing data to understand the correlation between disease prevalence and climatic conditions, growers can take appropriate action to mitigate disease outbreaks. In addition, data helps growers identify the causes of variations in output across sites and take corrective measures to improve crop quality and yield.
Finally, data can be used to optimize resource use, leading to reduced water and energy usage, and reduced dependence on pesticides. Overall, data-driven decision-making can help growers do their job better by improving productivity, quality, and sustainability.

Featured Resources


.png)


.png)


.png)


.svg)